Closing metrics
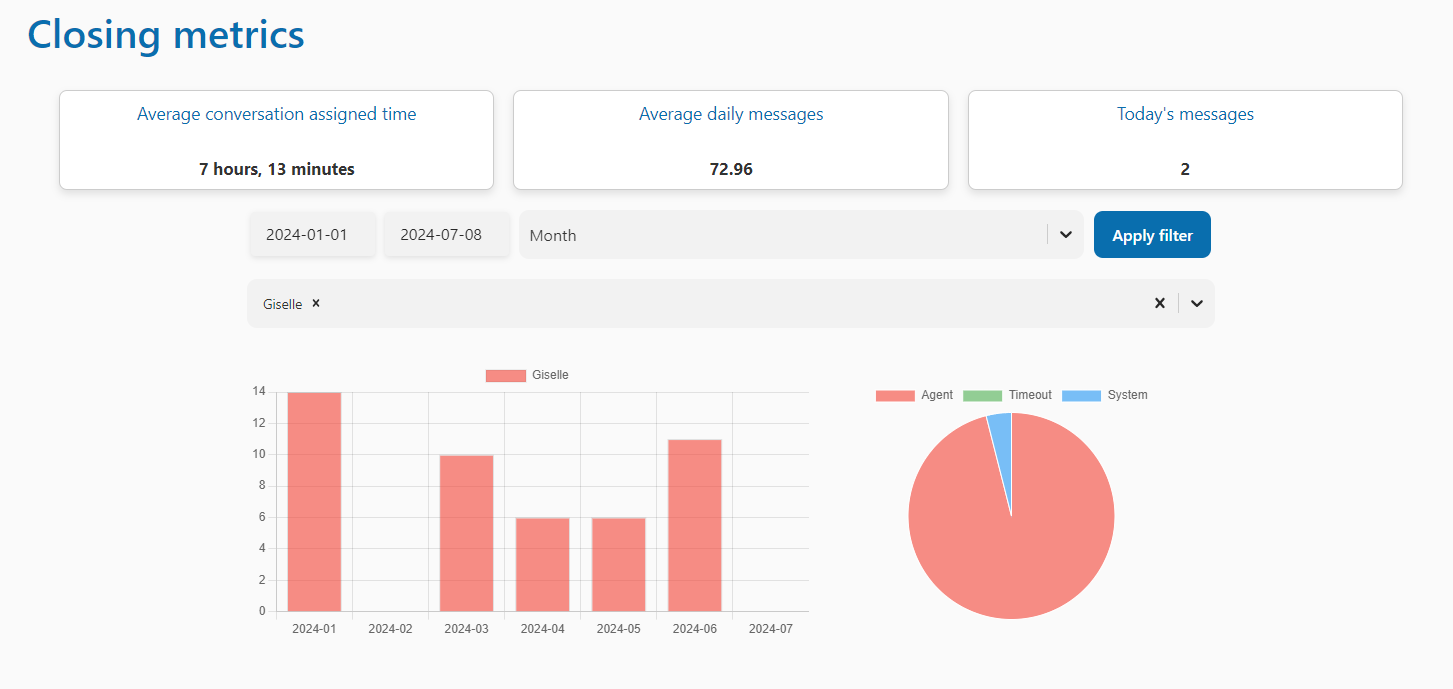
In this section, you will be able to see the following in the boxes: the average conversation assignment time, which indicates how long conversations are assigned to an agent; the average daily messages; and lastly, the number of messages received daily.
Below this, you will be able to apply a time filter and an agent filter. If you want to check on a specific agent, simply filter by time and by the agent's name.
This filtering will provide you with a bar chart and a pie chart. The bar chart indicates how many conversations the agent had, while the pie chart shows how the conversations were closed: by the agent, by the system, or due to a timeout.